I will consider as a prerequisite having the QGIS and Pycharm installed and knowing how to use them. Since we want to use Pycharm's remote debugging function we need to install the Professional version of Pycharm (as described by https://www.jetbrains.com/help/pycharm/remote-debugging-with-product.html).
We install the pydevd-pycharm library by opening the Pycharm QGIS plug-in project. Select Edit Configurations... from Run/Debug Configurations to open the edit page as shown below:
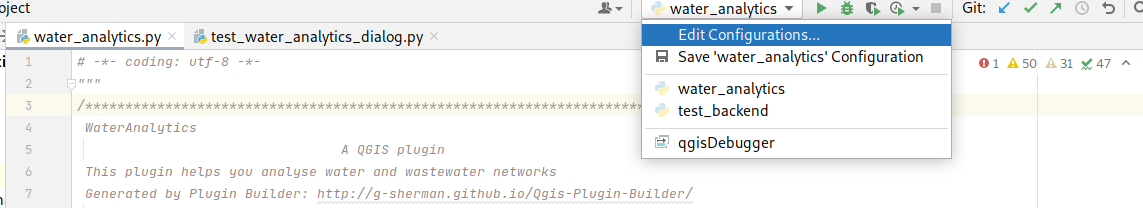
Use the + sign to add a new configuration (or Alt + Insert) and select Python Debug Server. In our case, we created a new Python Debug Server configuration called qgisDebugger in our case.
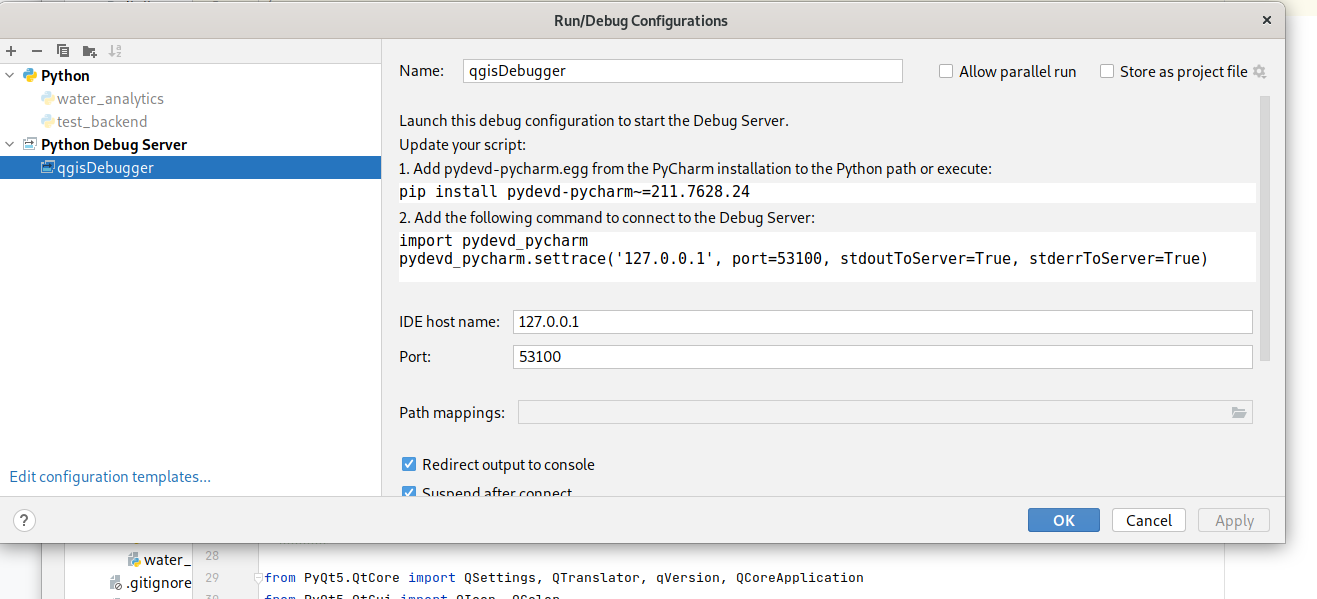
In order to have the debugger running, we need to install the pydevd-pycharm library as described by the message displayed on the right side of the window. For doing this you either use directly execute while in Python:
pip install pydevd-pycharm~=211.7628.24
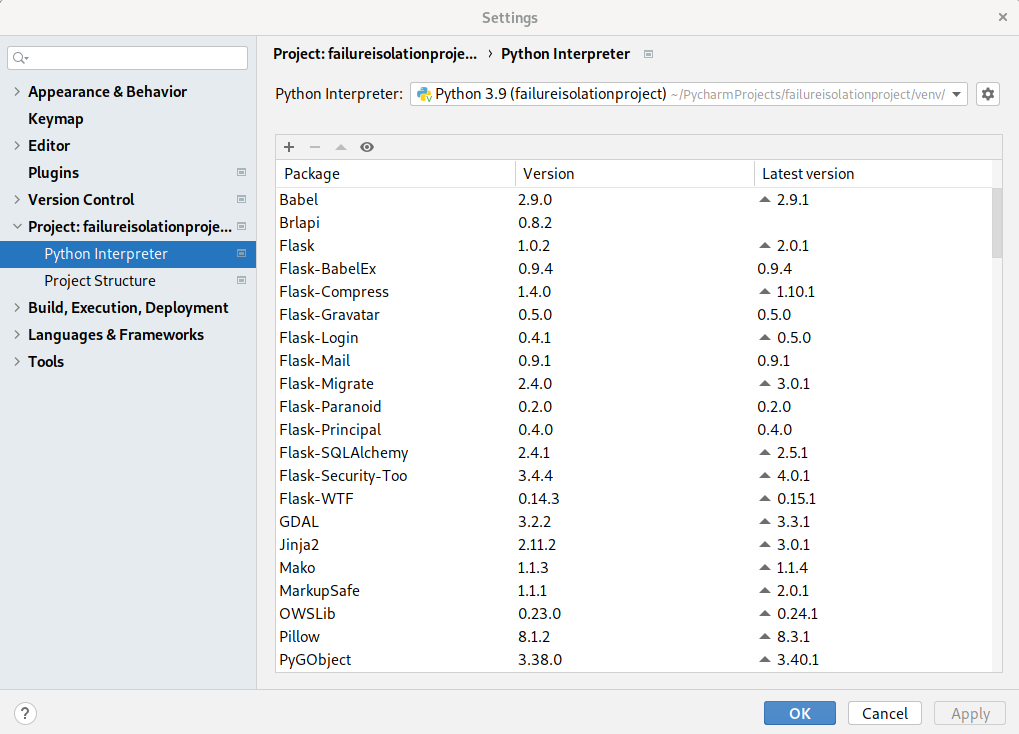
Or directly in Pycharm by using the interpreter settings as shown in the following picture:
After the pydevd-pycharm library was installed, we need to set-up:
- IDE host name as 127.0.0.1,
- Port as 53100,
- and have “Redirect output to console” and “Suspend after connect” selected.
Once we have the new Python Debug Server configuration saved, we need to perform one more action before being able to work with the debugger. Import the pydevd-pycharm package in the python module that needs to be debugged and copy the following statement:
pydevd_pycharm.settrace('127.0.0.1', port=53100, stdoutToServer=True, stderrToServer=True)
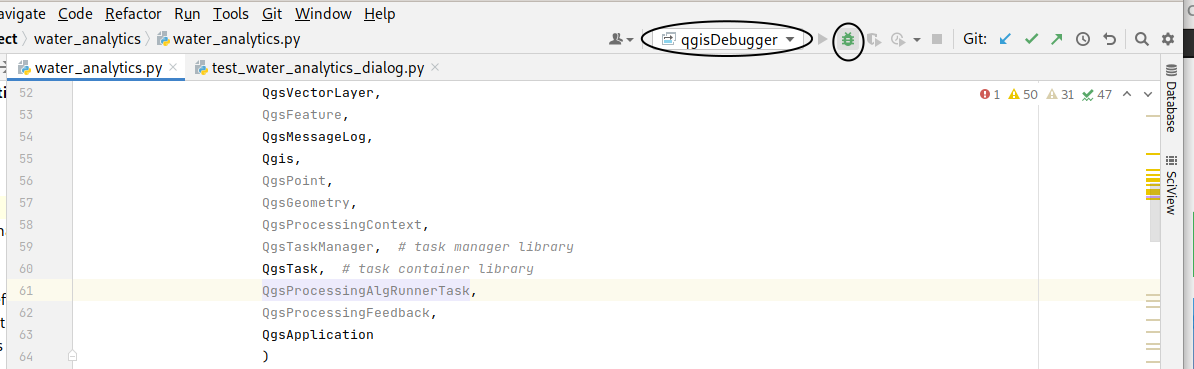
In the place where you want to stop first. The statement is equivalent to a breakpoint thus when the debugger is executed it will first stop at its position. Save the modifications and click on the debug button after yous elected the new configuration as shown in the below figure:
Once you click on the debug button in Pycharm, the server will wait for a connection (also shown in the terminal). Open the QGIS and (re)load the plug-in. First the operation will stop where we introduced the pydevdpycharm.settrace() command and after we continut at any breakpoint introduced by use in Pycharm.
If you want to run the plug-in code without the debugger, you need to comment out the pydevdpycharm.settrace(). Otherwise, QGIS will crash loading the plug-in without having the Debug Server started.